Projects and access
- Project namespaces, resource quotas and GPU budgets
- OIDC sign-in with user and group memberships
- Invoker, viewer, operator and admin roles with fail-closed policy and audit
A self-hosted Kubernetes ML platform for scheduled scoring, versioned datasets, model monitoring and governed serving, backed by a PostgreSQL control plane and a separate Go inference gateway.
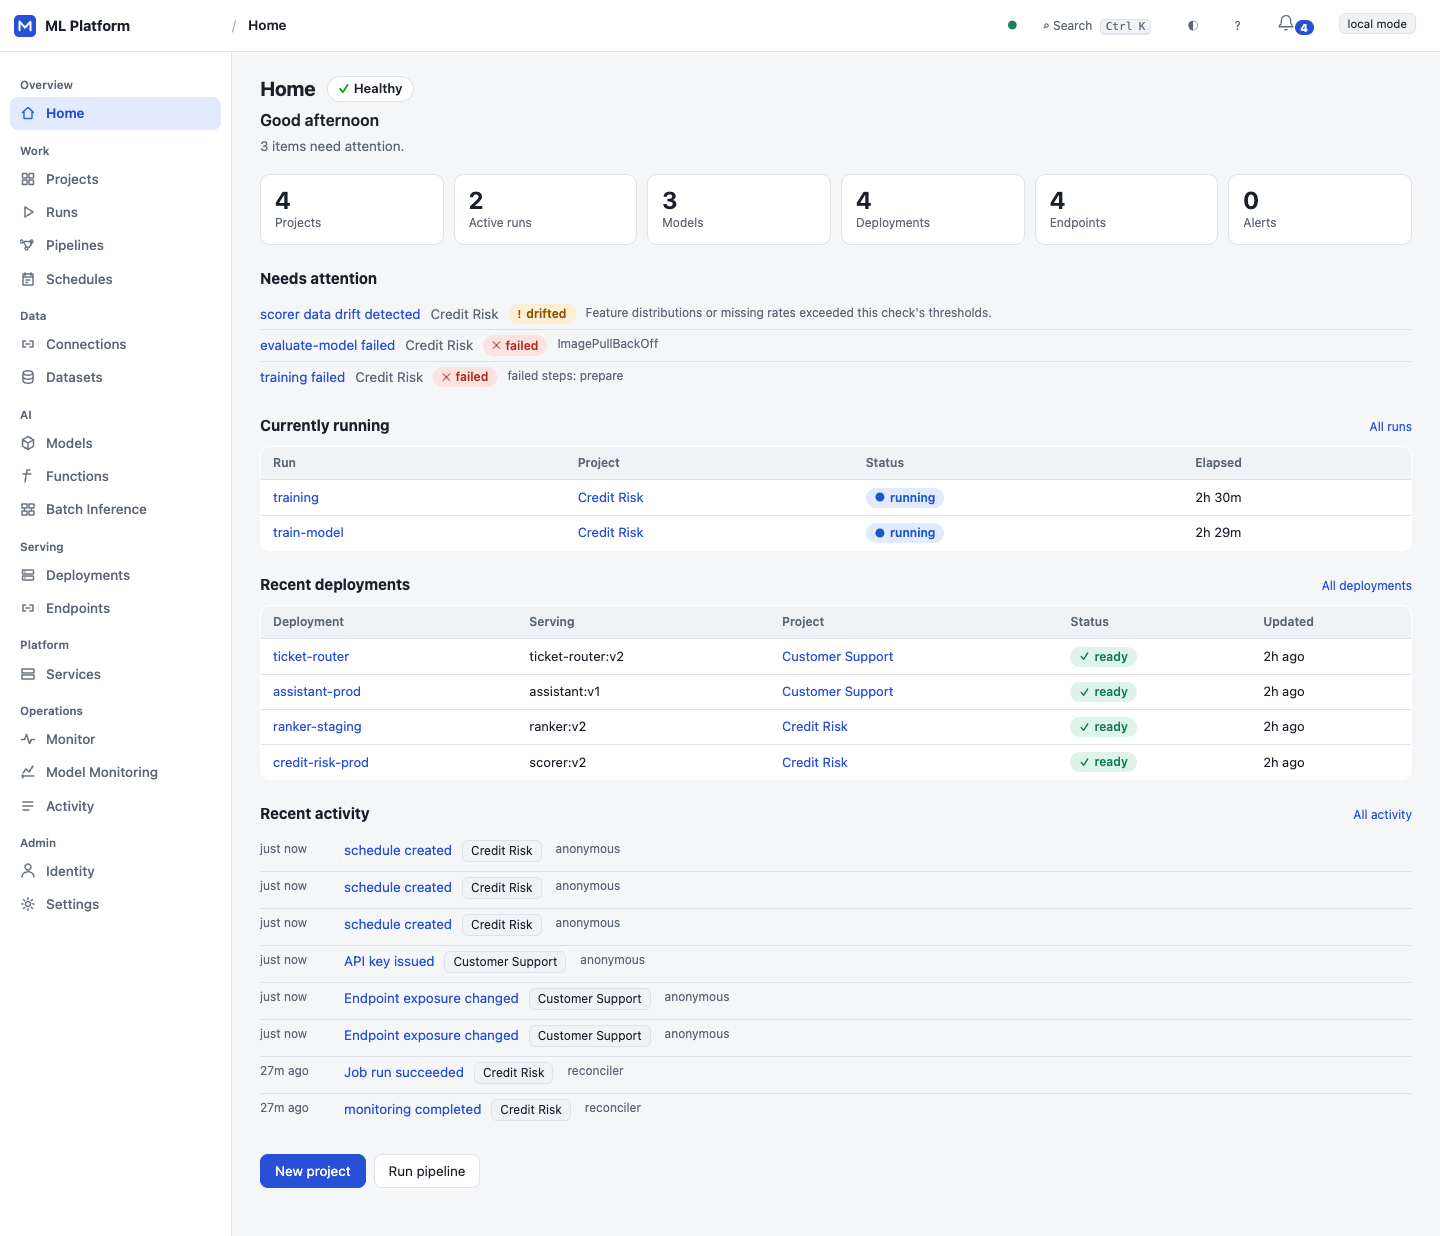
ML Platform organizes training, scheduled scoring, data lineage, model quality and serving around a shared project workspace. Each project has identity, roles, quotas and a durable record of the changes requested by its users.
PostgreSQL holds lifecycle intent. Reconcilers drive Kubernetes, Argo Workflows, MLflow and KServe toward it. A separate Go inference gateway governs model predictions, streaming chat and container-function calls, allowing management and serving traffic to scale independently.
Reviewed against main at 6d4e9a2 (8 October 2026). These are distinct acceptance checks on a single-node ARM64 kind laboratory, not a unified benchmark or customer deployment. The committed reports record methods, identities and artifact hashes; some raw data and logs remain in external archives.
| Evidence | What passed | Measurement boundary |
|---|---|---|
| CPU lifecycle | Training → registration/evaluation → real serving; healthy canary, candidate-only rollback and scale-to-zero/reactivation | Local ARM64 artifacts and local auth-none setup. GPU, real OIDC and multi-node resilience are separate gates. |
| Million-row replay | Scheduled scoring, versioned predictions, identical rerun bytes and independently checked quality report | Historical public data, warm images, one node. Model preparation and training happened locally before platform scoring. |
| Monitoring automation | Output v3 triggered a report; reconciler restart created no duplicate execution. 12/12 control-plane image checks passed. | The first dispatch exposed a missing runtime INSERT grant. Owner repair allowed retry; current migration/provisioning includes the grant. Deployed image a3202e3 precedes that provisioning fix. |
| Go gateway | Final-artifact soak: 150,000/150,000 requests; rolling restart: 200/200 real function responses; database outage/recovery | The 500 RPS soak returned 429 caller-debt rejections. Function probes were separate. Successful inference capacity and maximum throughput remain unmeasured. |
The NYC TLC case study uses one million cleaned, sampled taxi trips from each of January and February 2025. A fare model trains locally on 200,000 January rows, then enters MLflow with a frozen SHA-256 manifest. The platform owns the subsequent scheduled scoring and monitoring workflow.
The schedule resolves processing date 2025-02-01 to taxi-features v2. Typed parameters, model and dataset identities persist in an immutable execution snapshot before Argo starts work.
The worker verifies input integrity and the model manifest, then scores one million rows in 10,000-row batches. The recorded pipeline takes 18.95 s including Argo overhead, with a 1 CPU / 1 GiB main container and warm images.
Outputs carry their producer run, pipeline step, input dataset and model identity. An independent rerun publishes v2 at a separate S3 location with identical bytes; replaying its creation key returns the same run.
A separate monitoring Job joins every prediction by trip_id: 100% coverage, zero unmatched rows. MAE 2.082 USD, RMSE 4.466 USD and R² 0.920 agree with independent pandas/sklearn calculations. The Job takes 28.17 s in the recorded run.
A follow-up run publishes v3 and automatically creates monitoring. Publication and its outbox event commit together; a unique rule/dataset intent survives reconciler restart. Feedback is date-matched and frozen, or the execution waits within its deadline.
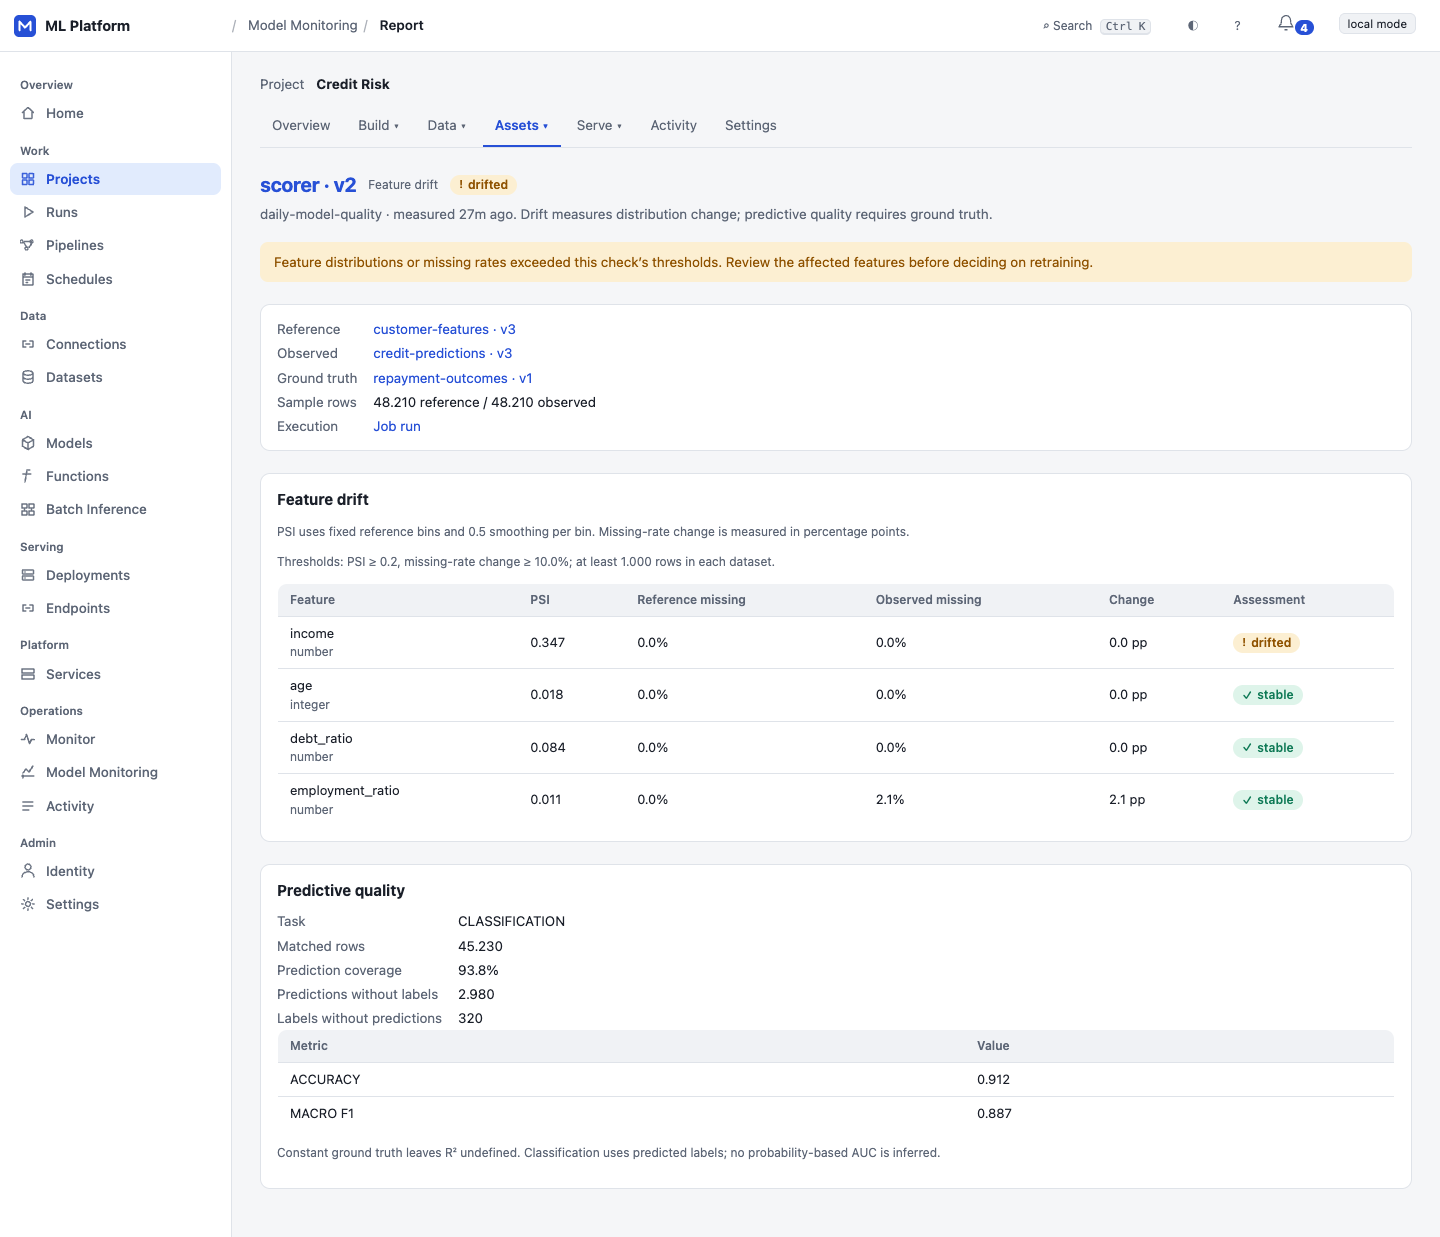
All four selected features were STABLE at PSI threshold 0.2 (PSI 0.000405–0.007974). That describes these cleaned windows; no drift was injected and STABLE does not rule out every quality problem. Ground truth was withheld before scoring, not collected from live inference. The demonstration schedule is paused.
One platform intent per dataset occurrence is not exactly-once external side effects. Monitoring failure is independent of producer success. Same-DAG dynamic output binding, rolling monitoring windows, online prediction capture and a Feature Store remain outside the demonstrated scope. Read the automation contract.
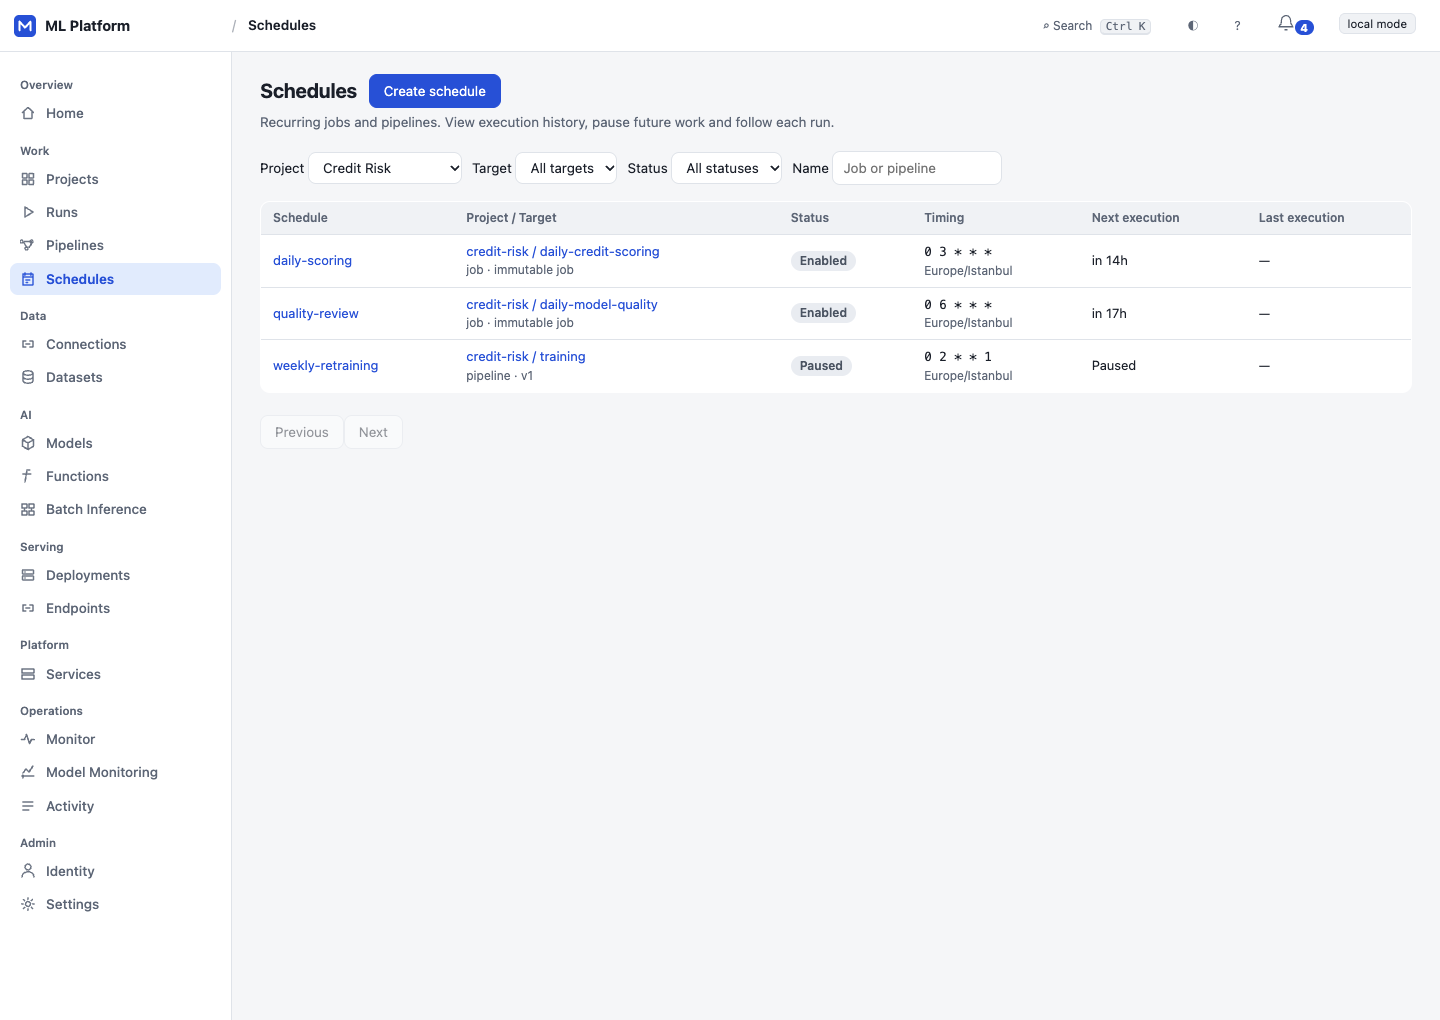
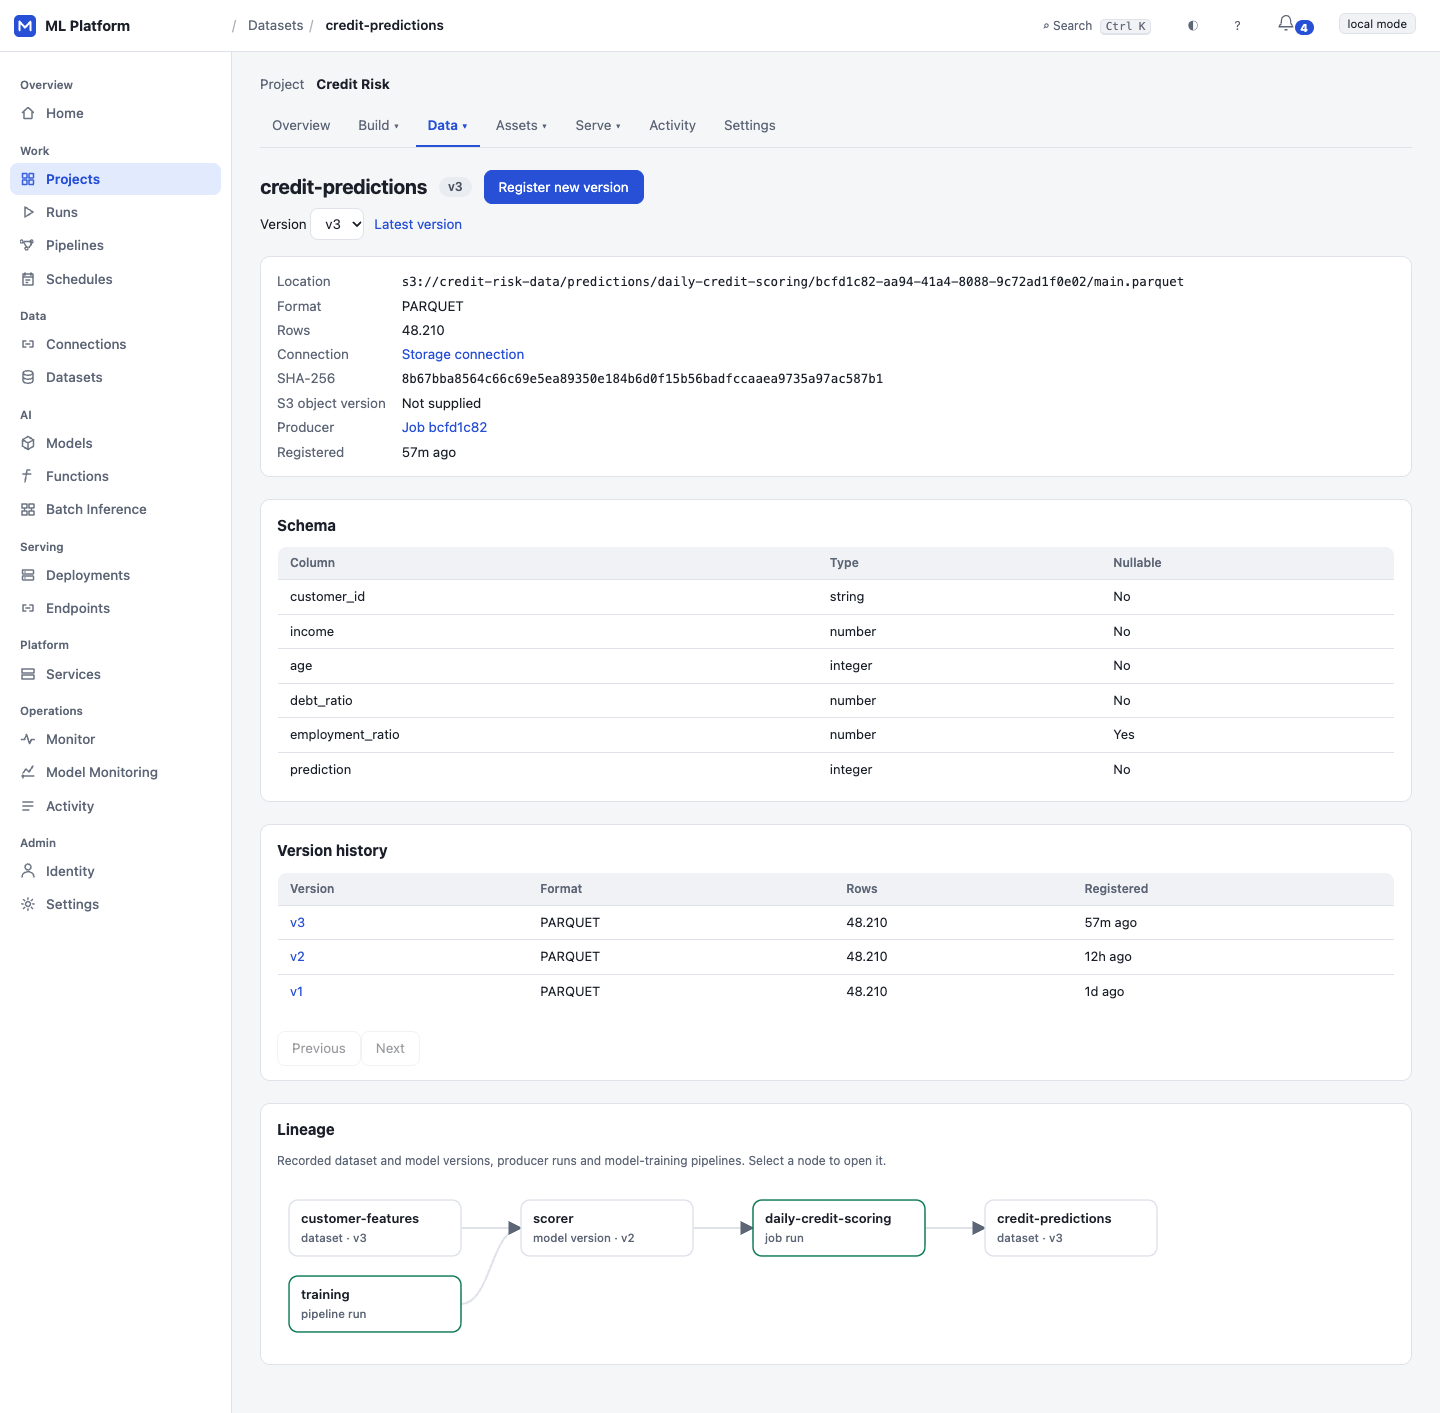
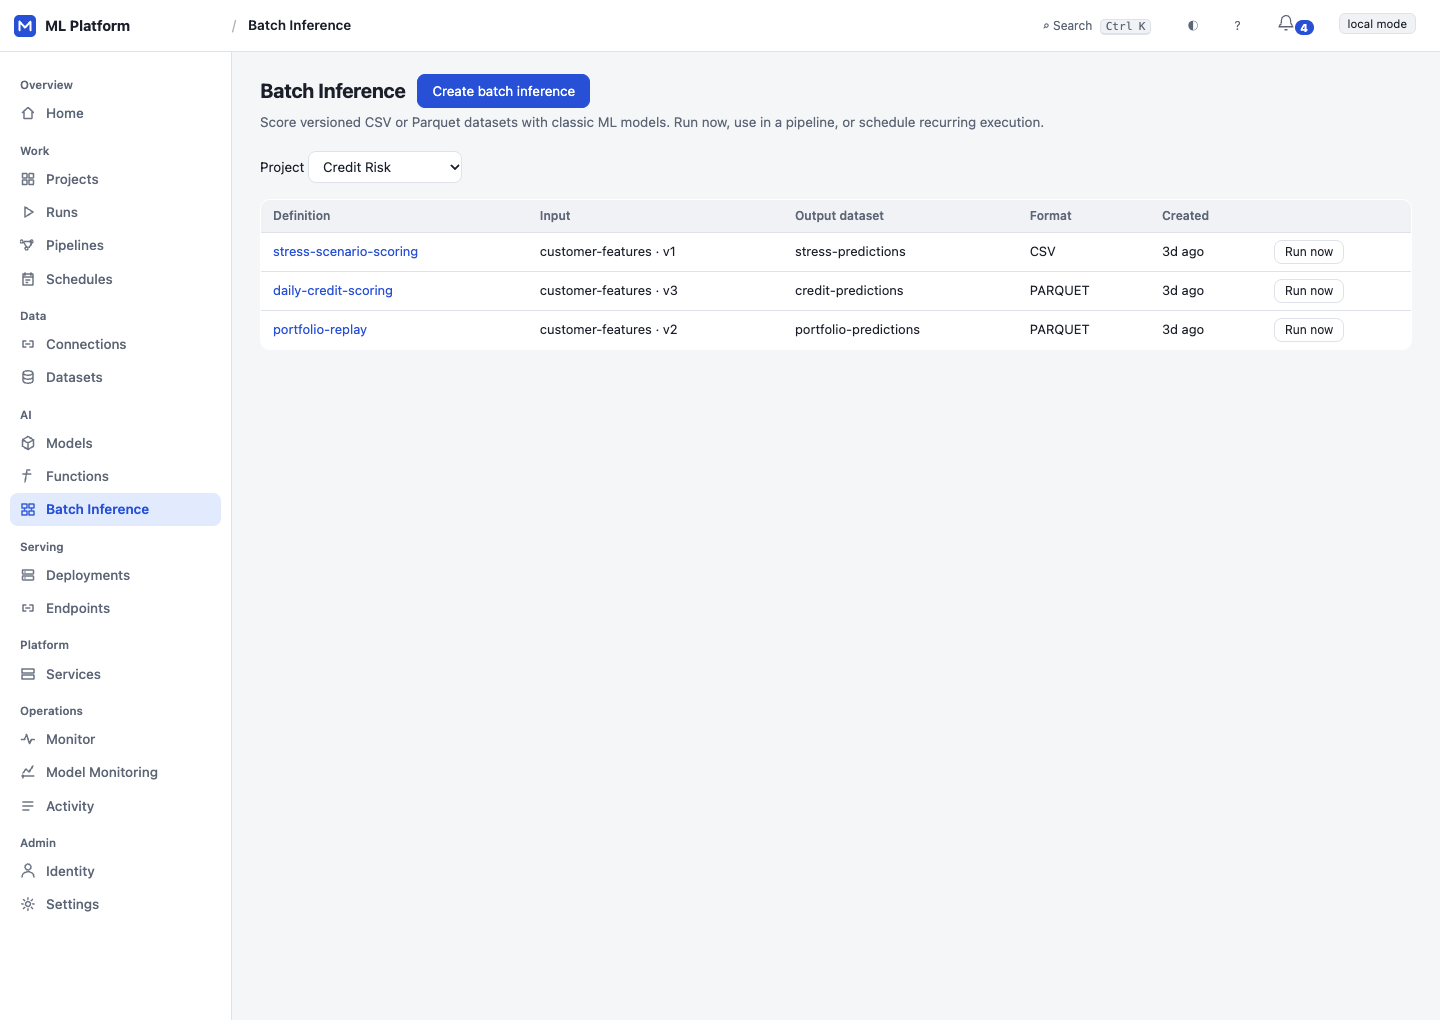
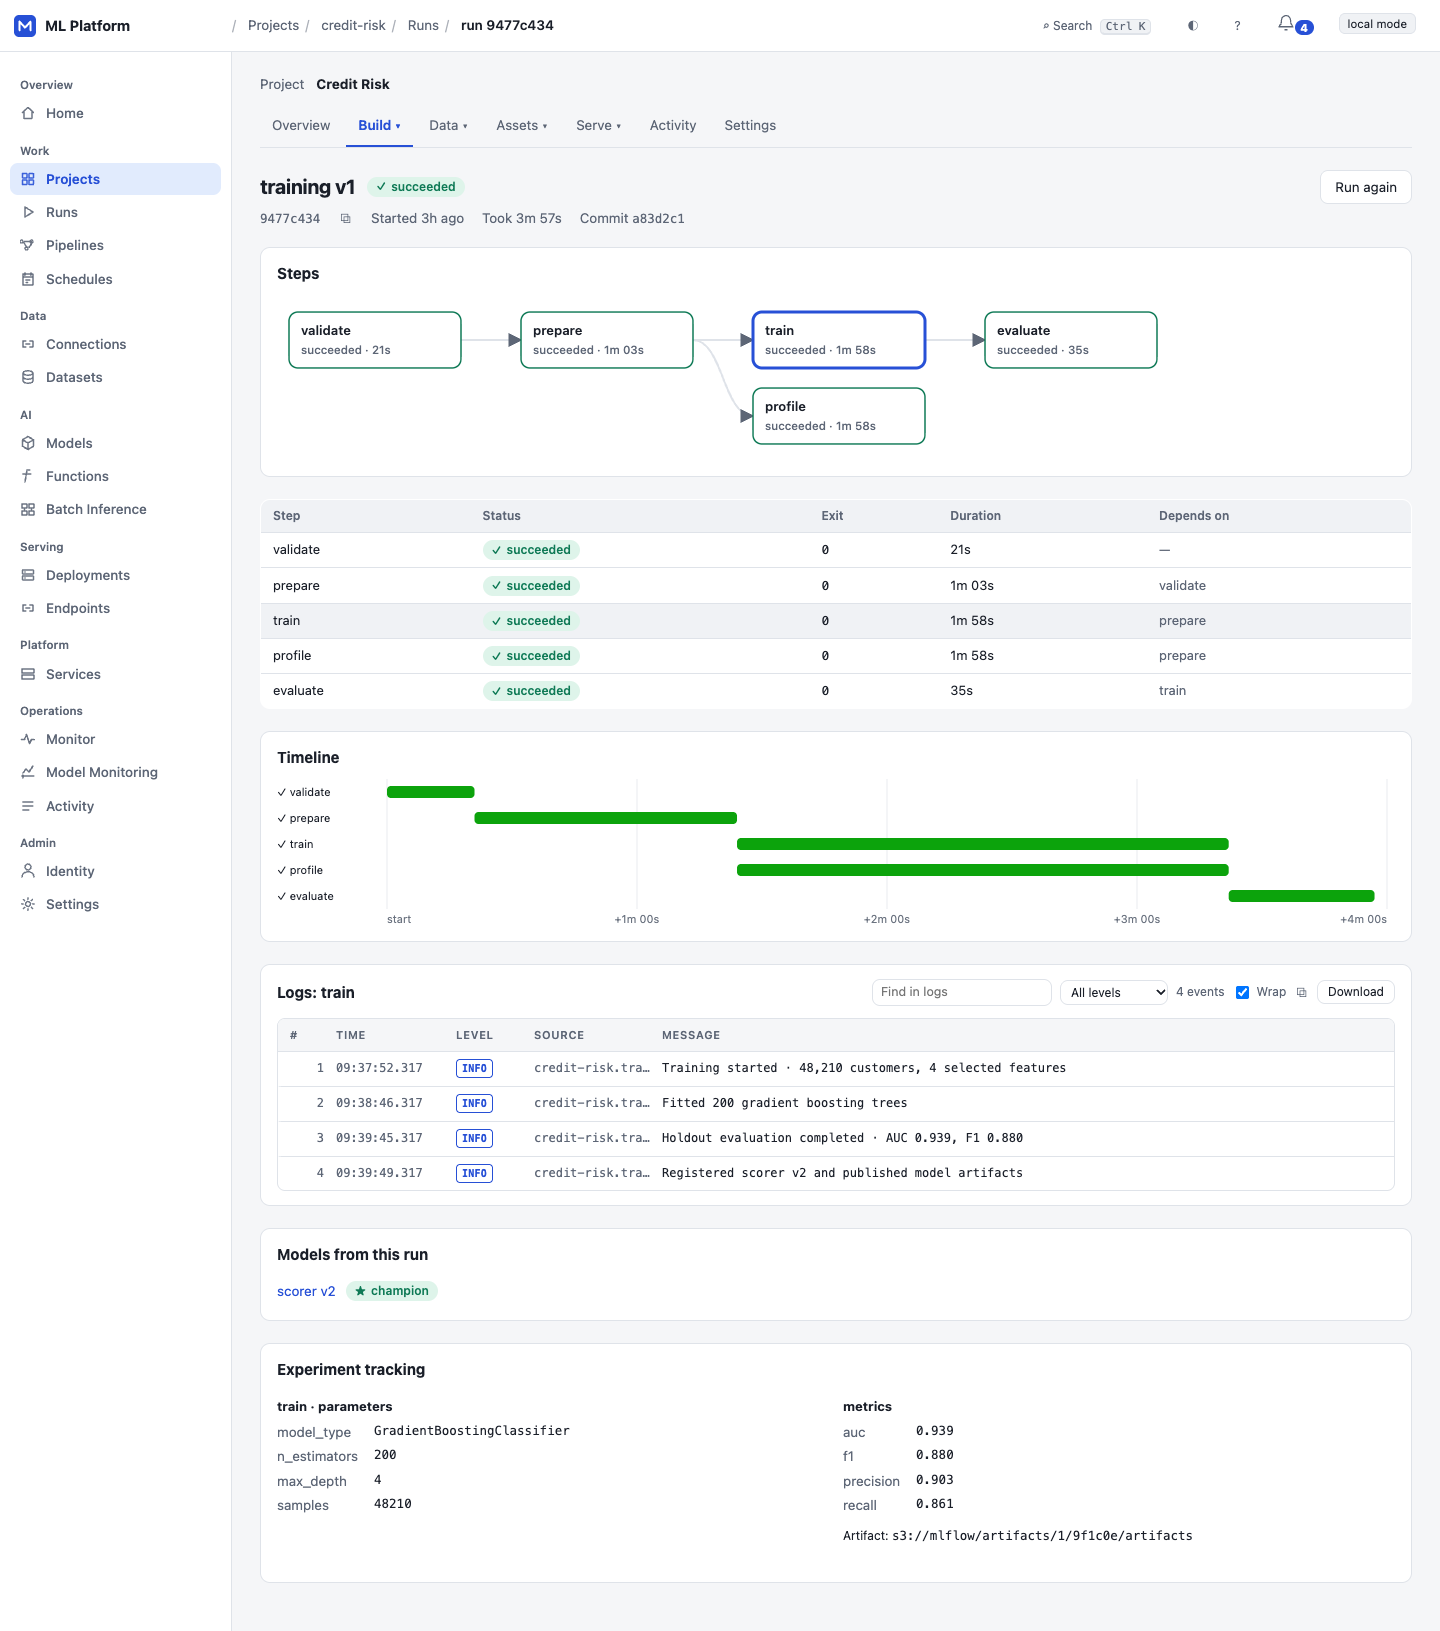
Current repository captures show schedules, versioned datasets, batch definitions and model-quality reports. The Credit Risk scenario uses synthetic demo data; these screens are separate from the real NYC acceptance evidence above.
The control plane records intent and returns; background reconciliation handles infrastructure. The data plane checks caller access and endpoint state before forwarding traffic. External systems sit behind adapters, keeping lifecycle rules independent of their SDKs. The API/reconcilers remain Python; the chart defaults to a separate Go gateway with a Python rollback option. The CPU path is lab-verified; the vLLM path below represents implemented contracts awaiting GPU acceptance.
The API records desired state; asynchronous reconcilers turn that intent into external resources.
Web workspace OIDC + project roles Control plane API. Control plane API commit intent PostgreSQL. PostgreSQL read desired state Reconcilers. Reconcilers apply + observe Kubernetes + Argo (namespaces, quotas, workflow DAGs). Reconcilers apply + observe MLflow + KServe (aliases, immutable serving revisions).
Prediction traffic bypasses the management API. Caller scope, endpoint readiness and budgets are checked at the gateway.
External caller predict, chat, invoke Inference gateway. Inference gateway forward / stream KServe + Knative. KServe + Knative serve MLflow server (classic model inference). KServe + Knative serve vLLM (GPU acceptance pending). KServe + Knative serve Container function (JSON invoke, scale to zero).
Freeze execution identities, publish versioned predictions and trigger an independent monitoring run through a transactional publication event.
Schedule + dataset dispatch Argo run Batch worker. Batch worker publish + commit S3 + dataset catalog. S3 + dataset catalog transactional outbox Monitoring rule + worker. Monitoring rule + worker persist report Model quality report.
Run lineage, evaluation and promotion govern which artifact becomes an immutable deployment revision.
Job / pipeline register output Model version. Model version acceptance thresholds Evaluation. Evaluation promote Champion. Champion create revision Deployment revision.
Durable trace context connects API changes to background work. Metrics inform both operations and release decisions.
API, reconcilers, gateway export OTel Collector. OTel Collector route Prometheus (health + revision metrics). OTel Collector route Tempo (request-to-reconciler traces). Prometheus and Tempo inspect Monitor + Grafana.
Architecture notes
The control plane records the project and memberships; the project reconciler targets a dedicated namespace with quotas, limits and network policy.
A job or DAG becomes desired state. Reconcilers submit Argo workflows and bring run status, steps and failure reasons back into the platform.
Register an MLflow artifact or Hugging Face version, evaluate it against acceptance thresholds, then promote an eligible candidate. Model-alias reconciliation aligns the registry with platform state.
An authorized request checks version eligibility, runtime kind and GPU quota, then commits the revision, desired deployment state and audit context to PostgreSQL.
Deployment reconciliation targets KServe readiness. The rollout loop shifts canary traffic, reads revision metrics and advances or rolls back according to its gates.
Callers use scoped API keys or OIDC tokens. The separate gateway resolves ready endpoints, applies limits, forwards or streams the response and records usage.
Registration, evaluation, promotion, deployment readiness and canary success are separate decisions with their own state transitions.
OIDC supplies identity. Project membership and a fail-closed policy table govern management operations; the gateway applies caller scope to exposed endpoints. Namespace policy and quotas define the workload boundary behind those application rules.
| Management plane | Inference data plane |
|---|---|
|
|
An API request records desired state and returns. Reconcilers compare that intent with external state and apply deterministic resources, so an interrupted operation can be resumed on a later pass.
The control plane governs projects and lifecycle changes. The inference gateway has its own process and pods, allowing prediction traffic and management operations to scale independently.
Domain and application layers import no frameworks or external SDKs. Kubernetes, Argo, MLflow, KServe, Prometheus and identity sit behind adapters; composition roots wire the implementation.
Immutable revisions bind an artifact to its runtime settings. Canary gates assess the candidate revision's error rate, p95 latency and traffic; a failed gate drives rollback instead of declaring a deployment healthy from readiness alone.
Lifecycle changes retain actor and trace context in durable state. Audit explains who requested the change, while reconciler spans connect asynchronous work back to that request.
The platform grew from a local Kubernetes inference service with MLflow, PostgreSQL, MinIO, GitOps and observability. The measurements below belong to that original infrastructure: they describe its load, autoscaling and recovery behavior, separately from the broader platform design.
Historical measurements remain scoped to the original service; the current Go gateway and expanded platform do not inherit its throughput. Original milestone record.
| Evidence slice | Foundation result | Scope |
|---|---|---|
| Load test | 645,809 requests, 0% errors | k6 against the live cluster; saturated throughput 2,935 req/s at a saturated /predict p95 of 32.9 ms. |
| Autoscaling | 2 → 6 replicas in 71s | HPA scale-up under load; scale-down back to 2 takes ~230s, stepped rather than immediate. |
| Recovery timing | 12–15s pod, ~1.4s drift | Pod deleted to replacement serving is 12–15s. Argo CD detects and reconciles config drift in ~1.4s, independent of its ~3 min Git poll. |
| Reproducibility | 11/11 acceptance, 901s | Cluster, images and build cache destroyed first, then make local-up → make local-test from the repo alone, proven in M11. |
| Failure engineering | 8 faults injected, not simulated | Run against the live cluster with measured detection and recovery, not described in documentation. |
| Security boundary | NetworkPolicy deny verified | inference → PostgreSQL directly is denied and confirmed by test, not assumed from the policy YAML; Pod Security Standards: restricted is enforced. |
| Scenario | Observed | Recovery |
|---|---|---|
| Pod crash | ReplicaSet notices; the surviving replica keeps serving | replacement ready in 12–15s |
| Invalid model artifact | readiness probe returns 503; pod held out of Service endpoints | Git revert |
| Artifact store outage | 100% of requests still return 200 while the pod is not ready | background recheck, 0 restarts |
| Config drift | Argo CD marks the app OutOfSync the moment it diverges | self-heal in ~1.4s |
| Bad rollout | maxUnavailable: 0 keeps old replicas serving | Git revert, bad ReplicaSet pruned |
| Node drain with a stateful pod on it | surviving inference pod absorbs traffic | PostgreSQL / MinIO reschedule automatically |
The control-plane Helm chart is deployed and runtime-verified on the local ARM64 lab. It defaults to two API, gateway and reconciler replicas, with PDBs and Lease-elected reconciliation. The AWS target is designed alongside it, backed by Terraform.
| Layer | Local target | AWS design target |
|---|---|---|
| Cluster | kind | EKS |
| Lifecycle database | PostgreSQL | RDS PostgreSQL |
| Artifacts | MinIO | S3 |
| Images | Local container images | ECR |
| Identity | Keycloak | Organization OIDC provider |
| Ingress | ingress-nginx + cert-manager | ALB or ingress + ACM |